Executive dashboard
The Executive dashboard is the one screen an owner or manager opens to see the whole company at a glance, straight from the ledger. It reads the same documents that Invoicing, Payments and Accounting write to, and turns them into a handful of numbers that matter: revenue, cash collected, work getting done, decisions waiting, compliance deadlines and where the next sales are coming from. Every figure is computed live, so the page moves the moment you post an invoice or record a payment.
The dashboard is built from companySnapshot, the same live company snapshot the Daily Brief and Ask AI use: only posted, non-draft, non-cancelled sales invoices count toward revenue, and the snapshot marks itself live once there is at least one such invoice. Until the ERPNext engine has data it falls back to the demo company, exactly like the rest of WorkOSync. The short narrative and the morning and evening synthesis belong to the AI Work OS layer.
Opening the dashboard
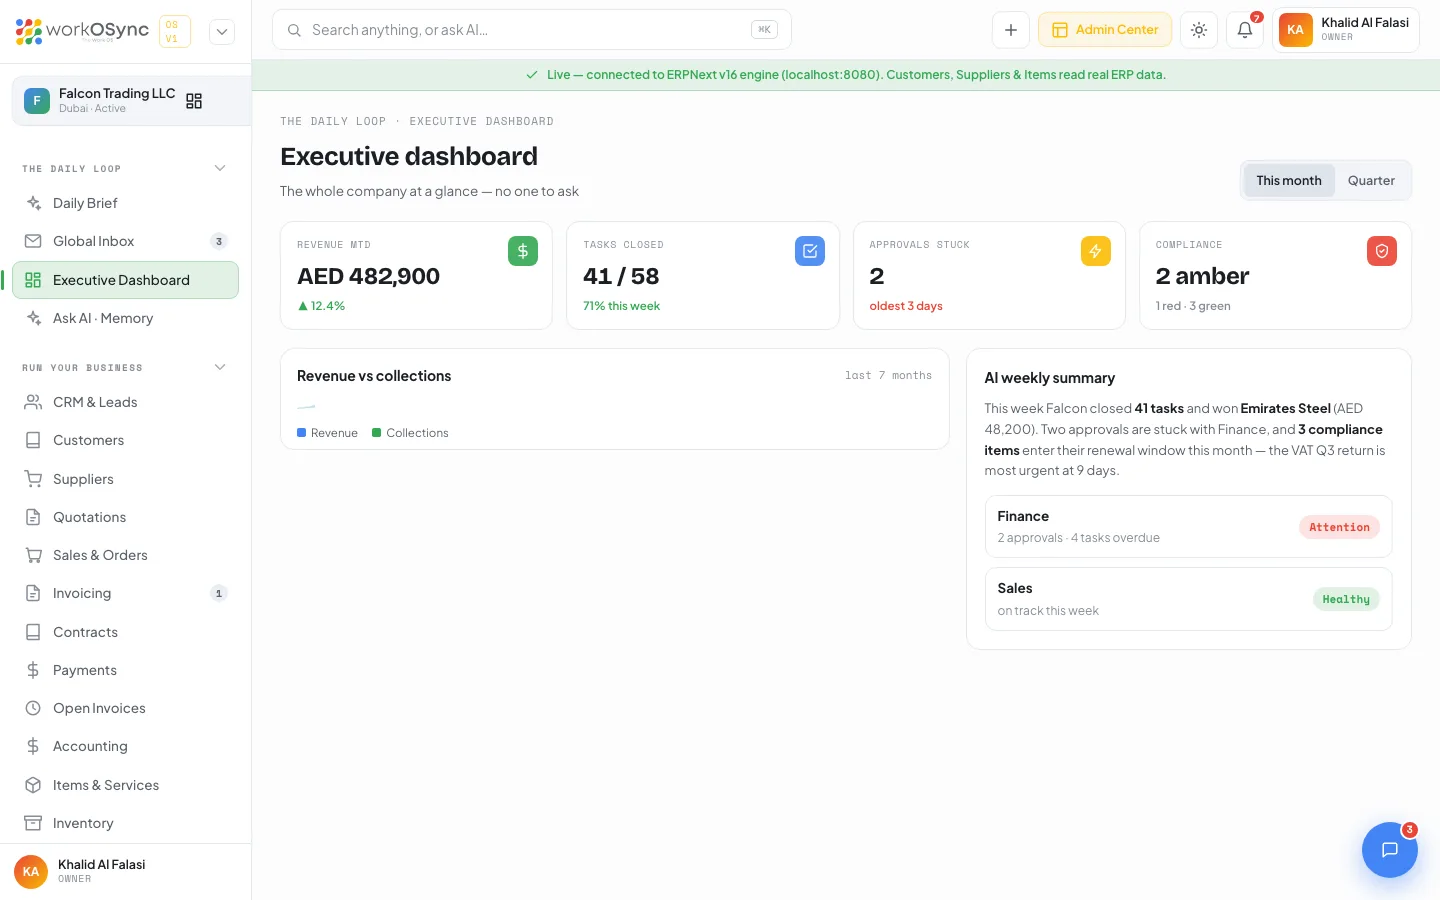
Open Executive dashboard from the sidebar, or go to /executive. The breadcrumb reads The Daily Loop · Executive Dashboard, the title is Executive dashboard and the subtitle is The whole company at a glance, straight from the ledger. A segmented period switch in the header toggles the page between Last 30 days and Last 90 days. Both windows are computed on the server, so the switch is instant and the only control on the page.
The headline KPIs
Four tiles sit across the top, each its own card with a value and a comparison against the matching prior period.
| Tile | What it measures |
|---|---|
| Revenue (30d) / Revenue (90d) | Invoiced sales over the trailing 30 or 90 days (the label follows the period switch), summed from posted tax invoices. The caption shows ▲ or ▼ and the percentage change against the immediately preceding window. |
| Tasks closed | {closed} / {total} tasks, with the percent complete, drawn from Projects and tasks. A read on whether the team is clearing work. |
| Approvals stuck | Leave, expense, purchase and document requests still waiting, from One-tap approvals, with the age of the oldest (oldest {n} days) or all cleared. |
| Compliance | A green, amber or red read on statutory deadlines from the UAE compliance tracker: {n} red, else {n} amber, else all clear, with the full green / amber / red split. A deadline already past is red, within 30 days amber, otherwise green. |
Revenue versus collections
The chart plots two series over the trailing months: Revenue (what you billed, a solid blue line with an area fill) and Collections (what you actually banked, a green dashed line, computed per month as the invoiced total less what is still outstanding). When the collections line trails the revenue line, cash is tied up in unpaid invoices, your cue to chase overdue accounts through Dunning. Both series share one scale in your reporting currency, AED by default.
A healthy business keeps the two lines close. A widening gap after a strong month is normal while invoices sit inside their payment terms; a gap that never closes means receivables are ageing. Cross-check with the AR ageing report in Accounting.
The narrative and drill-downs
Beside the chart, a plain-language paragraph states the period in figures: revenue booked and how it compares with the prior window, how much of it was collected, how many tasks closed, the biggest billings by customer, and receivables outstanding with the overdue portion. Below it, two clickable rows let you drill in:
| Drill-down | What it shows and where it goes |
|---|---|
| Finance | Cash on hand and the count of approvals waiting, badged Attention when anything is overdue or stuck, else Healthy. Opens Accounting. |
| Pipeline | Open deals and their weighted value from open leads and quotations, badged Active or Quiet. Opens the CRM pipeline. |
The top customers for the period are named in the narrative as the biggest billings, each an account you can open from its customer profile.
Using the dashboard
- Set the window
Switch between Last 30 days and Last 90 days. Every KPI, the narrative and the comparison recompute for the window you choose.
- Read revenue against collections
Check the revenue tile and the chart together. A healthy gap closes as invoices clear; a widening one points you at receivables.
- Clear what is stuck
Act on the Approvals stuck tile and the compliance read before they become problems, then open the Pipeline row for what is coming.
- Drill into the detail
Follow the Finance or Pipeline row, or open Reports for the full statements behind the headline numbers.
Nothing here is a figure to maintain by hand. Revenue and VAT come from Invoicing, cash from Payments and Banking, tasks from Projects, decisions from Approvals and deadlines from UAE compliance. The dashboard is a live roll-up, and the Daily Brief is the same data written as a morning brief.